Tradepal
Tradepal is your AI trading copilot that analyzes any stock chart instantly for clear insights.
AI tool Details
Explore More
Alternatives

About Tradepal
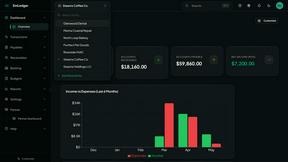
Tradepal is your AI-powered trading co-pilot, designed to integrate seamlessly into the workflow of active traders and investors. It provides fast, objective, and in-depth analysis of any U.S.-listed stock chart directly on your screen. The core idea is to eliminate manual guesswork and emotional bias by acting as a second set of eyes. Whether you're using TradingView, Thinkorswim, or any other charting platform, Tradepal works alongside it. You simply click 'Analyze' while the chart is on your screen or upload a screenshot via the web app. Instantly, the AI detects key technical patterns, support and resistance levels, trend strength, and momentum. It then generates clear, actionable scenarios—bull, base, and bear—complete with confidence scores and price targets. Built by traders for traders, Tradepal does not execute trades; it empowers you to validate ideas, spot risks earlier, and make more informed decisions with conviction. It's the lightweight, fast, and focused AI assistant that fits naturally into how you already trade, giving you an edge without the noise.
Features
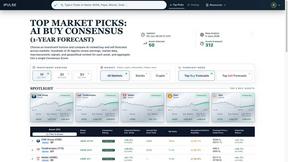
Universal Chart Analysis
Analyze any stock chart from any platform instantly. Tradepal's AI reads your chart or screenshot and delivers comprehensive technical analysis in seconds. It identifies patterns, key levels, and momentum, providing you with clear scenarios and price targets without needing to switch between complicated tools or platforms.
AI Price Forecasts & Cones
Get dynamic, intraday price forecasts and visualize future price movements with intuitive price cone projections directly on your chart. Powered by a blended AI ensemble that updates in real-time, this feature helps you anticipate potential ranges, reversals, and volatility before they fully manifest in the price action.
Real-Time Sentiment & News Stream
Track the market's mood in one consolidated stream. Tradepal aggregates sentiment from professional trader sources and financial news, allowing you to see when crowd conviction is building or shifting. This analysis helps you understand the narrative behind the price moves you're watching on your charts.
Smart Watchlists & Breakout Signals
Create personalized watchlists that do more than just track prices. Set smart alerts for unusual activity, risk stress events, and optimal trade sizing. The system also scans for early breakout signals by monitoring live sentiment streams and momentum shifts across your watched symbols.
Use Cases
Validating Trade Ideas
Before entering a trade, use Tradepal to get an objective, AI-powered second opinion. Upload your chart analysis to receive clear bull, base, and bear scenarios with confidence scores. This helps confirm your thesis or reveal potential blind spots, reducing emotional decision-making.
Scanning for New Opportunities
Efficiently scan the market for potential setups. Use Tradepal's watchlist alerts for unusual activity and breakout signals to identify stocks exhibiting early strength or weakness. This allows you to focus your manual analysis on the most promising candidates, saving valuable screen time.
Managing Trade Risk
Incorporate Tradepal's real-time AI forecasts and price cones into your risk management strategy. By visualizing potential future price ranges and volatility, you can better plan your stop-loss levels, position sizing, and exit strategies before a trade even begins.
Enhancing Charting Platform Workflow
For traders committed to their existing charting software, Tradepal acts as the perfect companion app. It runs lightly on your desktop, allowing you to analyze charts from Thinkorswim, TradingView, or any other platform with a single click, supercharging your toolkit without changing your primary workspace.
Frequently Asked Questions
How do I use Tradepal?
After signing up, you can download the Tradepal desktop app for macOS or Windows. It stays accessible on your screen while you trade. When viewing a U.S.-listed stock chart on any platform, simply click the 'Analyze' button within Tradepal. You can also use the web platform to upload a screenshot of a chart for the same instant AI analysis directly in your browser.
Is Tradepal financial advice?
No, Tradepal is not financial advice. It is an AI-powered analysis tool designed to provide objective technical insights and data to inform your own trading decisions. All trading decisions and their associated risks remain solely your responsibility. Tradepal acts as an informational assistant, not an advisory service.
What charts are compatible with Tradepal?
Tradepal is compatible with charts from any platform. It works by analyzing the visual data on your screen. As long as you are viewing a chart of a U.S.-listed stock, you can use Tradepal's desktop app to analyze it directly or take a screenshot to upload via the web app for the same detailed breakdown.
Do I need trading experience to use Tradepal?
While Tradepal is designed to be intuitive, it is built specifically for traders and investors. A basic understanding of stock charts and technical analysis will help you best interpret and apply the AI-generated scenarios and data. It is a tool to enhance an existing trading process, not a substitute for market knowledge.
Similar to Tradepal

Polymarket Trading Bot For Crypto
Polymarket Trading Bot For Crypto
EmLedger
EmLedger delivers real double-entry accounting for unlimited entities at one flat fee, not per-entity charges.
Decker
Decker empowers consultants to efficiently create, manage, and monetize deliverables with expert support and AI-driven workflows.

Liners Africa
Discover, compare, and review 1,500+ African software products with AI-powered insights and human-curated alternatives.