fnel vs Fusedash
Side-by-side comparison to help you choose the right AI tool.

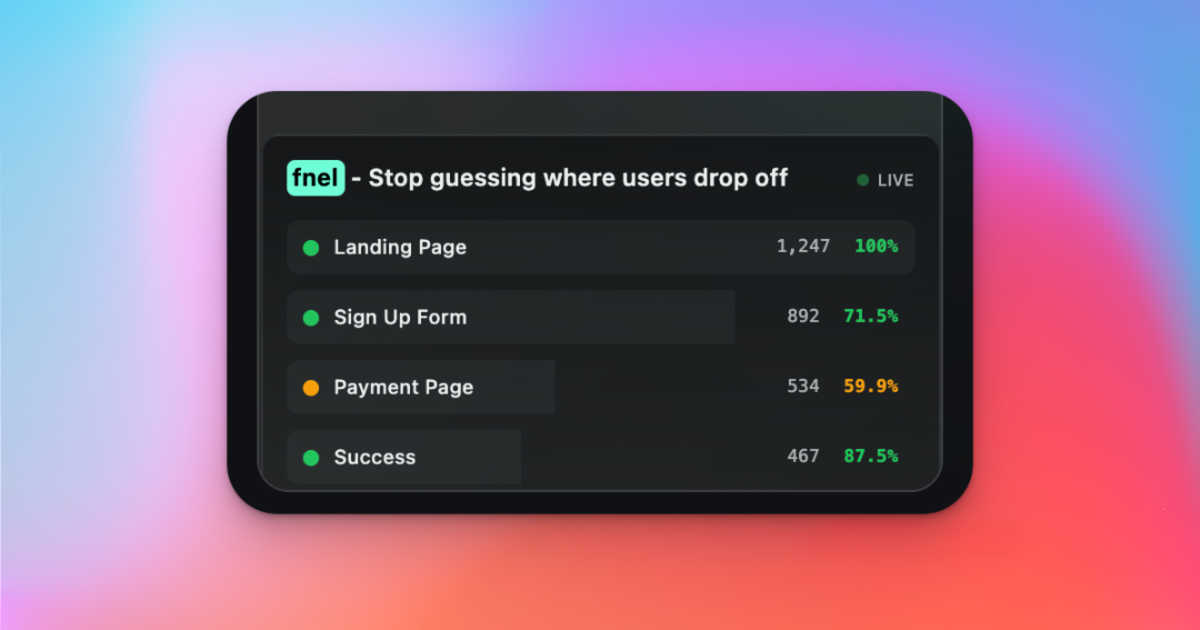
See exactly where users drop off in your funnel with one line of code.
Last updated: March 1, 2026
Fusedash instantly turns raw data into clear dashboards and charts for your team.
Last updated: March 4, 2026
Visual Comparison
fnel
Fusedash

Feature Comparison
fnel
Built for Your Funnel - Not a Generic Dashboard
fnel moves beyond generic dashboards by offering pre-configured funnel templates for the most common user journeys. Whether you're running a SaaS signup flow, an e-commerce checkout, or a lead generation sequence, you can instantly visualize the exact path you care about. This means you see precisely where potential customers abandon the process, from the landing page view all the way to the final "activated" or "order placed" event, without any manual data stitching or report building.
Real-Time Funnel Analytics with Smart Drop-Off Alerts
See your conversion data live as it happens. fnel's dashboard provides a clear, step-by-step visualization of your funnel, showing user counts and conversion percentages at each stage. More importantly, its intelligent system automatically detects and alerts you to sudden performance drops at any step. You'll receive immediate notifications, like a high drop-off at the payment page, so you can investigate and fix conversion leaks faster than ever before.
One-Line Setup & Zero Configuration
Integration is designed to be frictionless. Simply install the fnel package and add your API key with a single line of code. Once you start tracking events using simple fnel.track() calls, your funnel visualizations appear automatically in your dashboard. There is no need to define schemas, create custom reports, or wait for data to process. You can go from installation to actionable insights in under five minutes, making it the fastest way to add robust analytics.
A/B Test Validation at the Funnel Level
Move beyond vanity metrics and understand the real impact of your tests. fnel allows you to tag events with variant information, enabling you to compare how different A/B test versions (like pricing page layouts or CTA button colors) perform at each specific step of your funnel. See which variant drives more users from signup to activation with clear conversion lift percentages and confidence levels, ensuring you optimize what truly matters for growth.
Fusedash
Flexible Views
Build the right dashboard view for every audience within the same platform. Fusedash lets you transform a single dataset into interactive dashboards, standalone charts, detailed maps, or narrative report-style views. Customize layouts, filters, and time ranges for different stakeholders, ensuring each team sees what matters most without any extra back-and-forth or manual duplication of work.
AI Chart Generator
Instantly create clear, AI-powered charts from your CSVs or connected APIs. This feature acts as a fast visualizer, intelligently suggesting the right chart type, applying comparisons, and helping refine labels so your visuals tell the correct story at a glance. Generated charts can be used as standalone assets or seamlessly dropped into broader dashboards and reports for cohesive storytelling.
Unified Dashboard & Reporting Workspace
Go beyond static dashboards by combining real-time KPI monitoring with narrative context. This workspace allows you to embed storytelling sections directly alongside performance charts, making it clear what changed, why it matters, and what the next steps are. This integration reduces conflicting report versions and keeps all teams aligned on insights and actions.
AI-Powered Smart Chat
Accelerate data exploration and dashboard refinement using plain language. Ask questions about your data, request breakdowns by segment or region, and get intelligent suggestions for relevant metrics or chart types. You can then instantly turn these conversational insights into polished, shareable views that your team can use immediately within the platform.
Use Cases
fnel
Optimizing SaaS User Activation
For SaaS founders, understanding the path from signup to becoming an active, engaged user is critical. Use fnel to track the key steps in your activation funnel: landing page visit, account signup, email verification, onboarding completion, and first key action. Instantly identify where new users get stuck or lose interest, allowing you to streamline the onboarding process, improve tutorial clarity, and boost your activation rates efficiently.
Fixing E-Commerce Checkout Leaks
Cart abandonment is a major revenue leak for online stores. Implement fnel to visualize your checkout flow in real-time, tracking steps like cart view, shipping information entry, payment page load, and successful order placement. Pinpoint the exact stage where shoppers drop off—whether it's unexpected shipping costs or a confusing payment form—and make targeted improvements to recover lost sales and increase conversion.
Proving Marketing Campaign ROI for Agencies
Marketing agencies and consultants can use fnel to demonstrate clear value to clients. Set up a funnel for lead generation campaigns that tracks form submission, lead qualification, and booked discovery call. By connecting funnel steps to specific campaigns or ad sources, you can prove which marketing efforts are actually driving qualified leads and conversions, moving the conversation from clicks to tangible business results.
Validating Product Changes and New Features
When launching a new feature or redesigning a user flow, you need to know its impact on user behavior. Use fnel to create a specific funnel for the new journey. By comparing conversion rates before and after the change, or by A/B testing the new flow against the old, you get concrete, step-level data on whether your update improved the user experience or inadvertently created a new point of friction.
Fusedash
Executive & Leadership Reporting
Provide leadership with a single, trusted source of truth. Consolidate data from multiple departments into a unified executive dashboard enriched with narrative storytelling. This gives leaders a clear, high-level view of performance against KPIs with the necessary context to understand drivers and make strategic decisions confidently.
Marketing Campaign Analysis
Enable marketing teams to move from data to insight rapidly. Connect campaign data from various APIs, visualize performance trends with AI-generated charts, and drill down into segments to see what's working. Share live dashboards with stakeholders to demonstrate ROI and adjust strategies in real-time without manual report rebuilding.
Operational Performance Monitoring
Give operations teams a real-time interface to monitor key processes and metrics. Create dashboards with maps to visualize geographic performance, set up automatic data refreshes, and use drill-downs to identify bottlenecks or regional issues instantly, ensuring swift, data-driven operational responses.
Cross-Departmental Data Alignment
Eliminate silos and conflicting data stories across an organization. By defining core metrics once in Fusedash and reusing them in dashboards for sales, finance, and customer support, every department operates from the same consistent numbers. This fosters alignment, reduces reconciliation time, and ensures collaborative action based on a shared reality.
Overview
About fnel
fnel is a funnel analytics tool built from the ground up for the modern, mobile-first builder. It cuts through the overwhelming complexity of traditional analytics platforms by focusing on one critical question: where are users dropping off in your key conversion flows? Designed specifically for solo founders, indie hackers, and early-stage startups, fnel eliminates the days of setup and configuration headaches associated with tools like Google Analytics or Mixpanel. Its core value proposition is unparalleled speed and clarity. With just a single line of code, you can start tracking user events and immediately visualize your entire funnel in a real-time, intuitive dashboard. There are no endless menus to configure or complex data schemas to learn. Instead, you get a laser-focused, actionable view of user behavior from initial landing through to activation, checkout, or lead conversion. This streamlined approach helps you quickly identify leaks, validate the impact of A/B tests, and optimize for growth without wasting precious development or analysis time. fnel is the essential analytics companion for anyone validating an idea, running a side project, or scaling a SaaS product who needs to make fast, data-driven decisions and get back to what matters most: building.
About Fusedash
Fusedash is an AI-powered data visualization platform designed for teams that need clarity and action from their data, not just more charts. It acts as a unified mobile-first workspace where you can create decision-ready dashboards, interactive charts, detailed maps, and narrative reports without rebuilding the same logic across disconnected tools. The core value is consistency and efficiency: you define your key metrics and KPIs once, and then reuse those trusted definitions across every view and report. This ensures everyone—from leadership to marketing to operations—is aligned on the same numbers. Built for teams tired of manual reporting cycles and conflicting data stories, Fusedash empowers users to not only monitor what's happening through real-time interfaces but also understand why by drilling down into segments or time periods. With integrated AI features like natural language data chat and smart visualization assistance, it makes data exploration faster and more accessible. Simply connect your data via CSV or API, and Fusedash transforms it into a shared source of truth that drives alignment and informed action, all from an intuitive, app-centric interface.
Frequently Asked Questions
fnel FAQ
How is fnel different from Google Analytics or Mixpanel?
fnel is purpose-built exclusively for funnel analysis and speed. Unlike GA or Mixpanel, which require extensive configuration, complex event schemas, and manual report building, fnel delivers step-level insights and automatic drop-off detection out of the box. With one code snippet, you get immediate clarity on where users leave your key flows, eliminating days of setup and sifting through irrelevant data.
Is there a free plan available?
Yes, fnel offers a Free Starter plan designed for validation and early-stage projects. It includes up to 5,000 events per month and allows you to track up to 3 funnels. You can start using it immediately without providing a credit card. Upgrade to the Pro plan when you need higher event volumes, unlimited funnels, and advanced analytical features.
What does the Pro plan include?
The Pro plan is priced at $12 per month (or $9.99/month when billed annually). It includes up to 100,000 events per month, unlimited funnel tracking, access to the real-time analytics dashboard, advanced drop-off analysis, the ability to export your data (CSV/JSON), and priority support. It's tailored for founders who are serious about optimizing their growth.
What is included in the Lifetime Access offer?
The Lifetime Access offer is a one-time payment that grants you all the features of the Pro plan forever, with no monthly fees. This includes unlimited funnel tracking, lifetime updates to the platform, early access to new features, and premium support. It's a limited-time offer for users who want permanent access to fnel's analytics toolkit.
Fusedash FAQ
What types of data sources can I connect to Fusedash?
Fusedash is built for flexibility. You can start instantly by uploading CSV or Excel files. For live data, you can connect directly to various business APIs and databases. The platform also allows you to combine multiple datasets, including enriching your views with relevant public data, all within a single workspace.
How does the AI Chart Generator work?
The AI Chart Generator simplifies visualization. After you connect your dataset, the AI analyzes your data structure and suggests the most appropriate chart types to effectively communicate trends and comparisons. You maintain full control to refine labels, apply filters, and adjust the design, turning raw data into a clear visual story in minutes.
Can I create different views for different teams from the same data?
Absolutely. This is a core strength of Fusedash. You can build a master dataset with consistent metric definitions and then create multiple, tailored views from it. For example, a detailed, interactive dashboard for analysts, a high-level summary chart for executives, and a geographic map for field operations—all pulling from the same trusted source.
What is Smart Chat and how can it help my team?
Smart Chat is an integrated AI assistant within Fusedash. Instead of navigating complex menus, you can ask questions about your data in plain language, like "What were sales in Q3 by region?" or "Show me a breakdown of website traffic by source." The AI interprets your query, generates the answer visually, and helps you instantly convert that insight into a saved chart or dashboard view.
Alternatives
fnel Alternatives
fnel is a funnel analytics tool built for founders and indie hackers. It focuses on a single, critical job: showing you exactly where users drop off in your key conversion flows in real-time. This laser focus on clarity and speed makes it a favorite for mobile-first builders who need answers fast. Users often look for alternatives to fnel for various reasons. Some projects outgrow the initial feature set, requiring more advanced segmentation or user behavior analysis. Others might have specific budget constraints or need deeper integration with a broader marketing or data stack. The needs of a scaling enterprise differ from a solo founder's. When evaluating an alternative, consider your core requirements. Prioritize ease of setup and a clear, actionable dashboard if speed is key. Look for robust event tracking and real-time capabilities if you run frequent tests. Always weigh the complexity of the tool against the value of the insights it provides for your specific stage.
Fusedash Alternatives
Fusedash is an AI-powered data visualization and business intelligence platform. It helps teams unify their data to create consistent dashboards, charts, and reports, turning complex information into a shared source of truth for better decision-making. Users often explore alternatives for various reasons. These can include budget constraints, the need for specific integrations with their existing app stack, or requirements for more advanced or different feature sets. The search for the right tool is highly personal to a team's workflow and goals. When evaluating other options, consider your core needs. Look for a solution that offers the right balance of visualization power, ease of use, and collaborative features for your team's mobile-first, app-centric environment. Prioritize tools that provide consistent data definitions and real-time access to keep everyone aligned.