AI tool Details
Explore More
Alternatives
About LoadTester
LoadTester is a modern, cloud-native HTTP and API load testing tool designed for engineering teams who need fast, repeatable performance checks without the overhead of managing infrastructure. Built by Cloud Native d.o.o., this platform allows developers and QA teams to create, execute, and monitor load tests directly from their browser or integrated directly into their CI/CD pipeline. The core value proposition is simplicity: you can start a distributed load test in under three seconds, watch live metrics like throughput, latency, and error rates in real time, and automatically stop tests when predefined thresholds are breached. LoadTester supports both Virtual User (VU) and Requests Per Second (RPS) modes, giving you flexibility in how you simulate traffic. It handles worker scaling, infrastructure coordination, and execution flow automatically, so your team can focus on interpreting results and catching performance regressions before they impact end users. With features like scheduled baselines, run-to-run comparisons, exportable reports (PDF, CSV, JSON), and integrations with Slack, email, and webhooks, LoadTester is built for teams that want simple, repeatable, and actionable performance testing. A free plan is available, making it accessible for small projects and individual developers, while the platform scales to support enterprise workloads with up to 10,000 concurrent virtual users and 10,000 requests per second.
Features
Instant Distributed Execution
Start a load test in under three seconds with no infrastructure setup required. LoadTester automatically dispatches workers across a distributed network, scales them based on your test parameters, and manages the entire execution flow. You simply define the test scenario, choose between VU or RPS mode, set the duration, and hit run. The platform handles worker orchestration, scheduling, and coordination, eliminating the painful parts of traditional load testing like provisioning servers, configuring load generators, and managing queues. This means your team can run ad-hoc tests during development sprints or trigger them from CI/CD pipelines without any operational overhead.
Live Real-Time Analytics
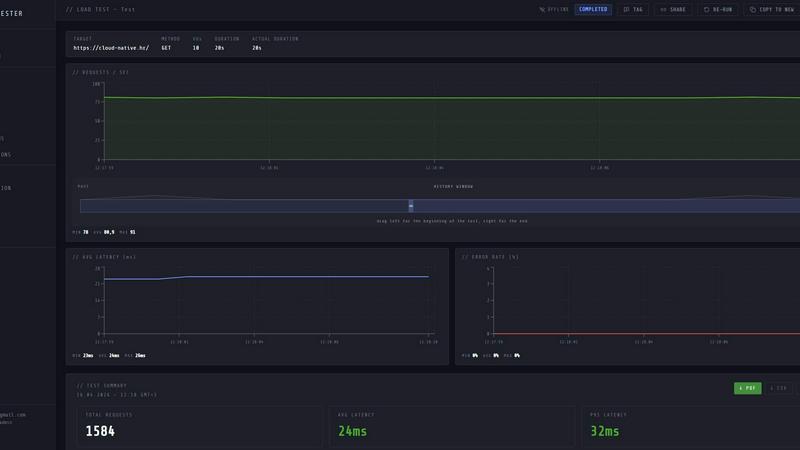
Watch your test results stream in live as the test runs, not five minutes after completion. LoadTester provides real-time charts for throughput (RPS), latency distribution (p50, p95, p99), active virtual users, and error rates. The live dashboard updates continuously, allowing you to spot bottlenecks, latency spikes, or error surges the moment they occur. This immediate feedback loop is critical for debugging performance issues during development, validating fixes, or understanding how your application behaves under load. The live view also shows a latency distribution graph over the last 60 seconds, giving you a clear picture of how response times evolve during the test.
Smart Auto-Stop with Thresholds
Set custom thresholds for latency (e.g., p95 latency under 400ms) and error rate (e.g., error rate below 2%), and LoadTester will automatically stop the test when those boundaries are breached. This guardrail feature prevents wasted resources and protects your application from prolonged stress testing when things go wrong. You can also configure regression thresholds that compare current results against a baseline run, and trigger notifications via Slack or email when performance degrades by a specified percentage (e.g., +15% latency increase). Additionally, webhooks can be triggered on test completion to post result links to release bots or other workflow tools.
CI/CD Integration and Automation
LoadTester is built for continuous performance testing in modern DevOps workflows. You can run tests on every deploy, schedule nightly baselines, or trigger tests from your CI/CD pipeline using the platform's API access. The tool supports webhooks for completion events, Slack and email alerts for threshold breaches, and exportable results in PDF, CSV, or JSON formats for integration with other tools. This automation ensures that performance regressions are caught before they reach production, and that your team has a historical record of application performance over time. Scheduled tests can run daily at specific times (e.g., 02:00 UTC) to establish baselines and monitor trends.
Use Cases
Pre-Deployment Performance Validation
Before shipping a new feature or code change to production, engineering teams can run a quick load test to validate that the application handles expected traffic without regressions. By setting p95 latency and error rate thresholds, the test automatically stops if performance degrades beyond acceptable limits. The results can be compared against a baseline run from the previous deployment, and Slack or email notifications alert the team if a regression is detected. This use case is critical for continuous delivery pipelines where manual performance testing would create bottlenecks.
API Endpoint Stress Testing
When developing or updating API endpoints, teams need to understand how they behave under peak load. LoadTester allows you to target specific endpoints (e.g., POST /checkout or GET /search) with a defined number of requests per second or virtual users. You can monitor live latency distribution, throughput, and error rates to identify bottlenecks in database queries, external service calls, or application logic. The instant execution and real-time analytics make it easy to iterate on performance fixes and immediately see the impact of code changes.
Capacity Planning and SLO Validation
For teams responsible for maintaining service level objectives (SLOs), LoadTester provides a repeatable way to validate that applications meet performance targets under expected and peak loads. By running scheduled baseline tests (e.g., nightly at 02:00 UTC), you can track performance trends over time, detect gradual degradation, and plan capacity upgrades before users are affected. The platform's ability to handle up to 10,000 virtual users and 10,000 requests per second makes it suitable for validating production-scale workloads.
Release Gate and Regression Detection
Integrate LoadTester into your release pipeline as a quality gate that automatically runs performance tests before a deployment is approved. By comparing each test run against a stored baseline, the platform can detect regressions in latency, throughput, or error rates and block the release or notify the team. Webhooks can post the result link to a release bot in Slack, and email alerts can be sent to the engineering team. This use case ensures that performance is treated as a first-class citizen in the deployment process, catching issues before they reach end users.
Pricing
LoadTester offers a free plan with basic features to get started. For teams that need higher limits, advanced automation, and dedicated support, paid plans are available with tiered pricing based on usage and feature requirements. Specific pricing details for paid tiers can be found on the LoadTester website under the Pricing section. The platform is built to scale from individual developers running occasional tests to enterprise teams with continuous performance testing needs.
Frequently Asked Questions
How quickly can I start a load test with LoadTester?
You can start a distributed load test in under three seconds from the moment you define your test parameters. LoadTester handles all infrastructure provisioning, worker scaling, and execution coordination automatically. There is no setup, no server configuration, and no queue time. Simply create your test scenario in the UI or via API, choose your mode (VUs or RPS), set the target URL and duration, and hit run. The platform dispatches workers immediately and begins generating traffic within seconds.
What kind of metrics can I see during a live test?
During a live test run, LoadTester displays real-time metrics including requests per second (RPS), latency percentiles (p50, p95, p99), total requests completed, error count and rate, active virtual users, and a latency distribution graph over the last 60 seconds. All metrics update continuously as the test runs, allowing you to monitor performance in real time. After the test completes, you get a clear summary with total requests, average latency, p95, data sent, and data received, plus exportable reports in PDF, CSV, or JSON formats.
Can I integrate LoadTester with my CI/CD pipeline?
Yes, LoadTester is built for CI/CD integration. You can trigger tests via API, configure webhooks for test completion events, and set up Slack and email alerts for threshold breaches or regression detections. The platform supports scheduled tests that run automatically at specified times (e.g., nightly baselines). Results can be exported in machine-readable formats (JSON, CSV) for integration with other tools in your pipeline. This makes it easy to add performance testing as a gate in your deployment process.
Is there a free plan available and what are the limits?
Yes, LoadTester offers a free plan that allows you to get started without any upfront cost. The free plan includes access to the core features including instant execution, live analytics, and basic threshold settings. For higher limits such as more concurrent virtual users, higher requests per second, longer test durations, and advanced features like scheduled tests and API access, you can upgrade to a paid plan. The platform supports up to 10,000 VUs and 10,000 RPS for enterprise workloads, with a cold start time under three seconds and auto-scaling workers.
Similar to LoadTester
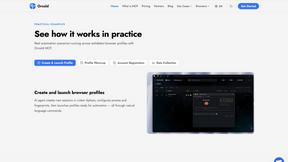
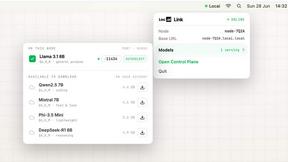
Locai
Locai lets you run powerful AI models on your own hardware, keeping data private and cutting cloud costs.
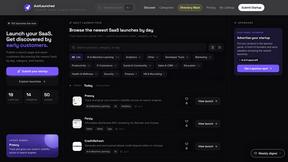
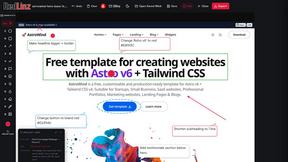
JustLaunched
JustLaunched helps indie makers schedule launches, reach buyers, and blast across curated directories to get discovered.
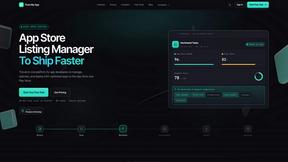
Push My App
Push My App generates search-optimized metadata, designs screenshots, scans for rejection risks, and submits directly to Apple and Google from one.