Dividend Data
Access 30+ years of dividend data and financials instantly in Google Sheets or Excel with our easy-to-use add-in for investors.
AI tool Details
Explore More
Alternatives

About Dividend Data
Dividend Data is an innovative tool that empowers dividend and fundamental investors by providing access to over 30 years of stock market data for more than 80,000 tickers directly within Google Sheets and Microsoft Excel. Designed with the needs of dividend investors in mind, Dividend Data eliminates the complexities often associated with data retrieval by allowing users to simply input custom formulas and receive live updates. This means no more tedious API keys, coding, or manual data entry. Investors can instantly access key metrics such as dividends, yields, payout ratios, growth rates, financial statements, earnings, ratios, and price history. With its free tier offering 2,500 monthly credits and a suite of 16 custom functions, Dividend Data is built for those who seek institutional-grade data without the associated cost. Whether you are a seasoned investor or new to the stock market, Dividend Data provides the tools necessary to make informed investment decisions effortlessly.
Features
Free Tier with Monthly Credits
Dividend Data offers a generous free tier that provides users with 2,500 monthly credits, allowing them to access data without any trial expiration. This makes it an ideal option for casual investors or those testing the waters of dividend investing.
Custom Functions for Investors
With 16 specialized custom functions, Dividend Data covers a comprehensive range of metrics that dividend investors require for effective analysis. From dividend yields to payout ratios, investors can easily retrieve the data they need to make informed decisions.
Extensive Historical Data Access
Dividend Data boasts over 30 years of historical stock market data, enabling users to analyze long-term trends and performance metrics. This depth of information empowers investors to make strategies based on historical performance and future projections.
Seamless Integration with Spreadsheets
The tool is designed to work seamlessly within both Google Sheets and Microsoft Excel. Investors can automate their data retrieval processes without needing to rely on external APIs or complicated coding, enhancing their overall productivity.
Use Cases
Quick Dividend Analysis
Investors can use Dividend Data to quickly analyze stocks by entering simple formulas. For example, typing =DIVIDENDDATA_DIVIDENDS("AAPL") provides instant access to the forward-looking annual dividend per share, facilitating rapid decision-making.
Portfolio Management
Dividend Data allows users to track their dividend portfolios automatically. Investors can link their portfolios to the tool and view aggregate statistics, enabling them to monitor performance and make adjustments as necessary in real-time.
Historical Performance Review
With over 30 years of historical data, investors can conduct in-depth reviews of stock performance over time. This feature is crucial for identifying trends and making informed predictions about future stock behavior.
Financial Metrics Retrieval
Dividend Data simplifies the process of retrieving critical financial metrics such as PE ratios, EPS, and payout ratios. By utilizing its custom formulas, investors can access vital information quickly, thus enhancing their analysis capabilities.
Frequently Asked Questions
What types of data can I access with Dividend Data?
Dividend Data provides access to a wide range of stock market data, including dividends, yields, payout ratios, growth rates, financial statements, earnings, ratios, price history, and over 100 additional metrics, all available through custom formulas.
How do I get started with Dividend Data?
Getting started is simple! You can access Dividend Data through Google Sheets or Microsoft Excel. Just sign up for a free account, and you will receive 2,500 monthly credits to begin using the various functions and features immediately.
Is there a limit to the data I can access?
While the free tier offers 2,500 monthly credits, you can access a vast amount of data for over 80,000 tickers. If you need more credits, you can explore additional pricing options to suit your needs.
Can I use Dividend Data for real-time stock analysis?
Yes, Dividend Data is designed for real-time stock analysis. By entering the appropriate custom formulas, you can receive live updates on stock metrics, ensuring you have the most current information at your fingertips for smarter investment decisions.
Similar to Dividend Data


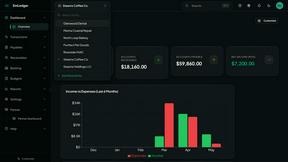
EmLedger
EmLedger delivers real double-entry accounting for unlimited entities at one flat fee, not per-entity charges.
Decker
Decker empowers consultants to efficiently create, manage, and monetize deliverables with expert support and AI-driven workflows.

Liners Africa
Discover, compare, and review 1,500+ African software products with AI-powered insights and human-curated alternatives.

FX Radar
FX Radar delivers real-time forex news and an AI-powered trading journal to track your performance.