
StatPecker
StatPecker turns your data into instant AI insights and stunning visuals for free.
AI tool Details
Alternatives
About StatPecker
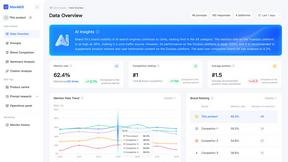
StatPecker is an AI-powered data visualization tool that transforms the complex task of data storytelling into a simple, fast, and intuitive experience on any device. Designed for the modern creator and analyst, it instantly converts raw data and simple questions into stunning, publication-ready infographics. The core value proposition is clear: democratize data visualization. You don't need to be a data scientist or a graphic designer to create impactful visuals. StatPecker is built for a diverse mobile-first audience, including content creators looking to enrich blogs, marketers crafting compelling reports, educators simplifying complex topics, and business analysts needing quick, credible insights. It bridges the gap between data and narrative, allowing users to extract trends, visualize comparisons, and share insights without ever leaving their workflow. By offering features like a local SQL agent for private CSV analysis, StatPecker ensures both power and privacy, making it an essential app for anyone who needs to communicate with data effectively and beautifully.
Features
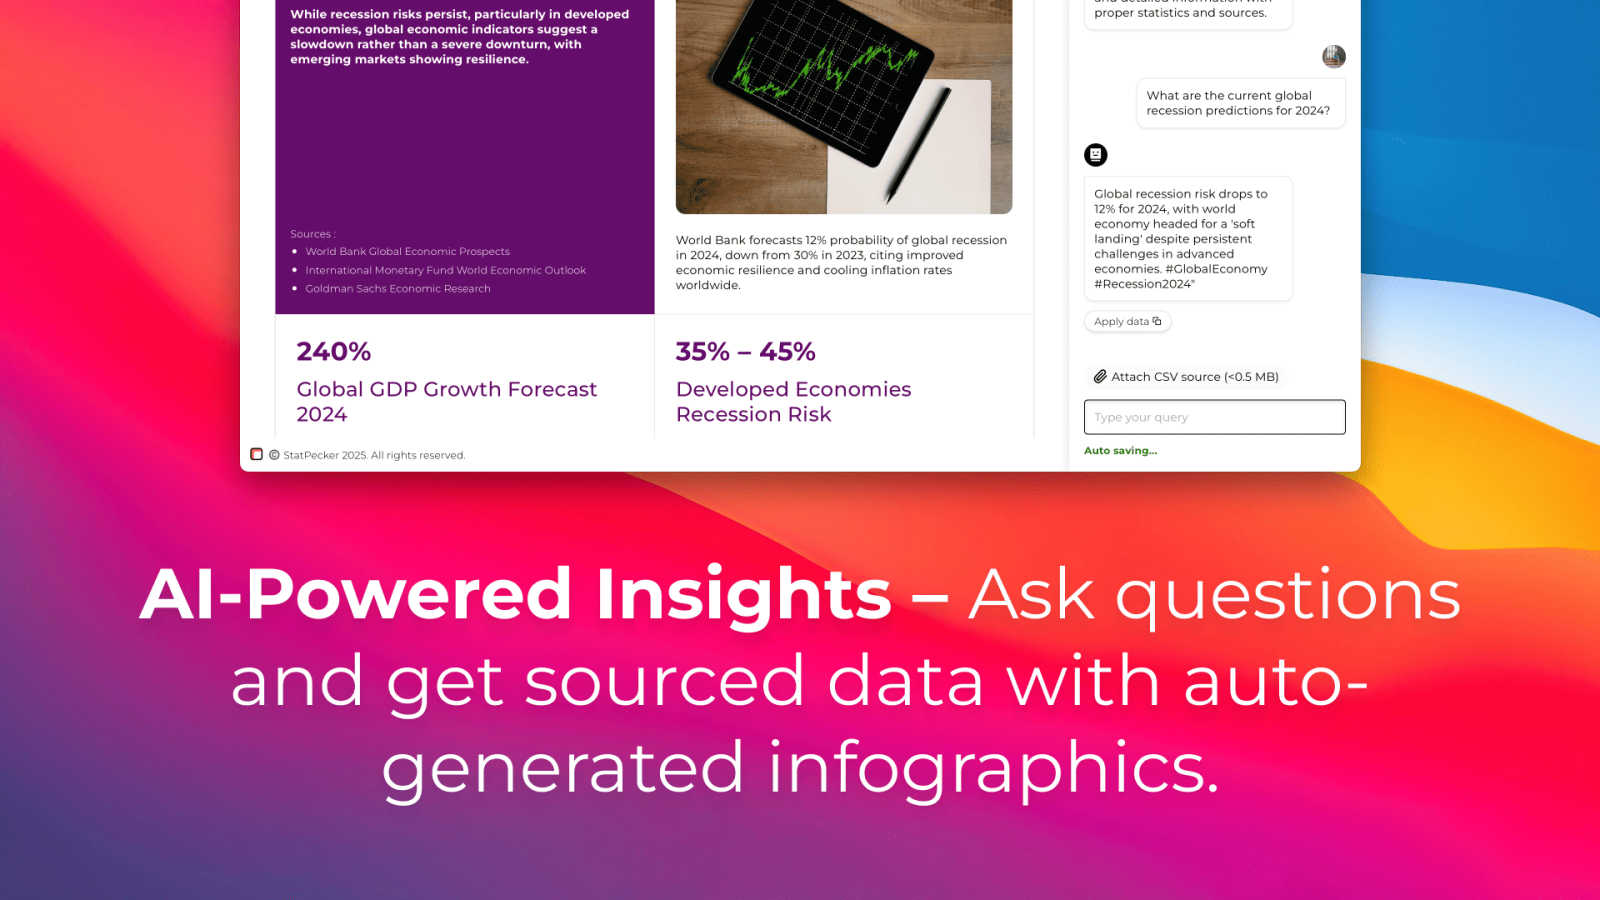
Ask Your Query
Get instant, credible insights without complex tools. Simply type your question in plain English, and StatPecker's AI queries validated data sources to generate the answer. This feature turns curiosity into clear visuals in seconds, perfect for quick research or validating a hypothesis on the go, directly from your phone or tablet.
Upload & Analyze CSVs
Go beyond public data by analyzing your private information securely. Upload a CSV file directly from your device, and StatPecker's local SQL Agent processes everything on-device. Your data never leaves your phone or computer, ensuring complete privacy while you explore trends, summarize figures, and extract key insights without spreadsheet hassle.
Publish & Embed
Seamlessly integrate your created visuals into your digital content. StatPecker generates interactive charts and infographics with embed codes, making it easy to add them directly to blogs, articles, websites, or internal wikis. This creates a dynamic, engaging experience for your audience without requiring any coding or design software.
Download & Use Anywhere
Export your finished infographics as high-quality image files with a single tap. This allows for maximum flexibility, letting you instantly use your visuals in reports, slide presentations, social media posts, or printed materials. Your data stories are ready to share anywhere, in any format you need.
Use Cases
Content Creation & Blogging
Bloggers and digital writers use StatPecker to quickly find supporting data and create custom infographics that boost article credibility and engagement. Instead of searching for generic charts, they can generate unique visuals that perfectly match their narrative, making complex topics accessible and shareable for their readers.
Business Reporting & Analysis
Analysts and managers leverage the CSV upload feature to turn internal sales, marketing, or operational data into clear charts for weekly reports or team meetings. They can ask specific questions like "Which product line had the highest growth last quarter?" and get a visual answer ready for a presentation in minutes.
Educational Material Development
Educators and trainers use StatPecker to simplify complex statistical or historical data for students. By transforming datasets into easy-to-understand infographics, they can create more engaging lesson plans, handouts, and presentation slides that help students grasp difficult concepts visually.
Marketing & Social Media
Marketing professionals create eye-catching data-driven content for social media campaigns and reports. They can visualize market research, campaign performance metrics, or industry comparisons to tell a compelling brand story, drive engagement, and present results to stakeholders with professional clarity.
Pricing
StatPecker offers a straightforward, transparent pricing model with two main plans. The Free Tier ($0) provides a robust starting point with unlimited projects, 25 AI queries, 10 CSV uploads, and unlimited embeds with manual editing capabilities. For users who need unlimited access and premium features, the Lifetime Access plan is available for a one-time payment of $150 (currently offered at a 25% discount). This plan grants lifetime access to all features, including unlimited AI queries, unlimited CSV uploads, unlimited projects and embeds, and priority support for feature requests, backed by a 10-day money-back guarantee.
Frequently Asked Questions
Is my data private when I upload a CSV?
Yes, absolutely. When you use the Local SQL Agent feature to upload a CSV, all data processing and analysis happen directly on your device. Your file is not sent to StatPecker's servers. This ensures complete privacy and security for your sensitive business or personal information.
Do I need design or coding skills to use StatPecker?
No, you do not. StatPecker is designed to be intuitive and user-friendly. The AI handles the complex parts of data querying and visual design. You simply ask a question or upload a file, and the tool generates a professional infographic for you to use, publish, or download immediately.
What are the limits of the Free Tier?
The Free Tier is a great way to start. It includes unlimited projects and embeds, 25 AI queries to ask questions, and 10 CSV uploads for private analysis. This allows you to fully explore the app's core functionality and create a significant amount of content at no cost.
Can I edit the infographics after they are created?
Yes, you can. While StatPecker AI generates the initial visual, the platform provides options for manual edits on your embeds. You can adjust colors, and text, and sometimes chart types to better fit your brand or presentation needs before publishing or downloading the final graphic.
Similar to StatPecker

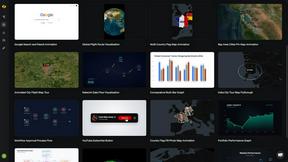
Easymotion - AI Motion Graphic Generator
AI motion graphics and map animation generator for content creators, editors, founders and marketers.
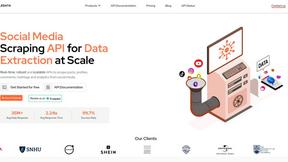
EnsembleData
EnsembleData provides real-time social media data APIs to effortlessly scrape and analyze posts, profiles, and engagement metrics at scale.
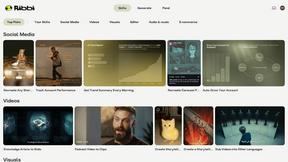
Ribbi
Ribbi automates your social media content creation and performance tracking with a self-evolving AI for effortless engagement and growth.
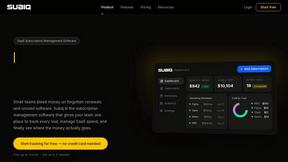
Subiq
Subiq gives small teams one place to track, manage, and cut unused SaaS subscriptions to stop wasted spend.

Toon Tone
Toon Tone is a free daily game where you guess cartoon character colors using HSB sliders to test your memory and perception skills.